 |
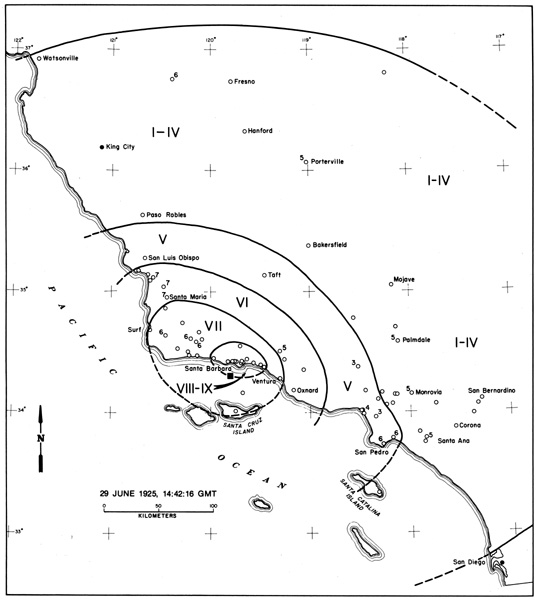
| Isoseismal map, Santa Barbara earthquake, 29 June 1925. From Toppazada and Parke (California Geology, June 1975, p. 122). Roman numerals indicate Modified Mercalli intensities within each zone. Open circles represent locations of reported intensity. Intensity values are depicted only where they differ with the intensities with the zone containing them. Black dots represent locations where the earthquake was not felt, and the square represents the epicenter. |