|
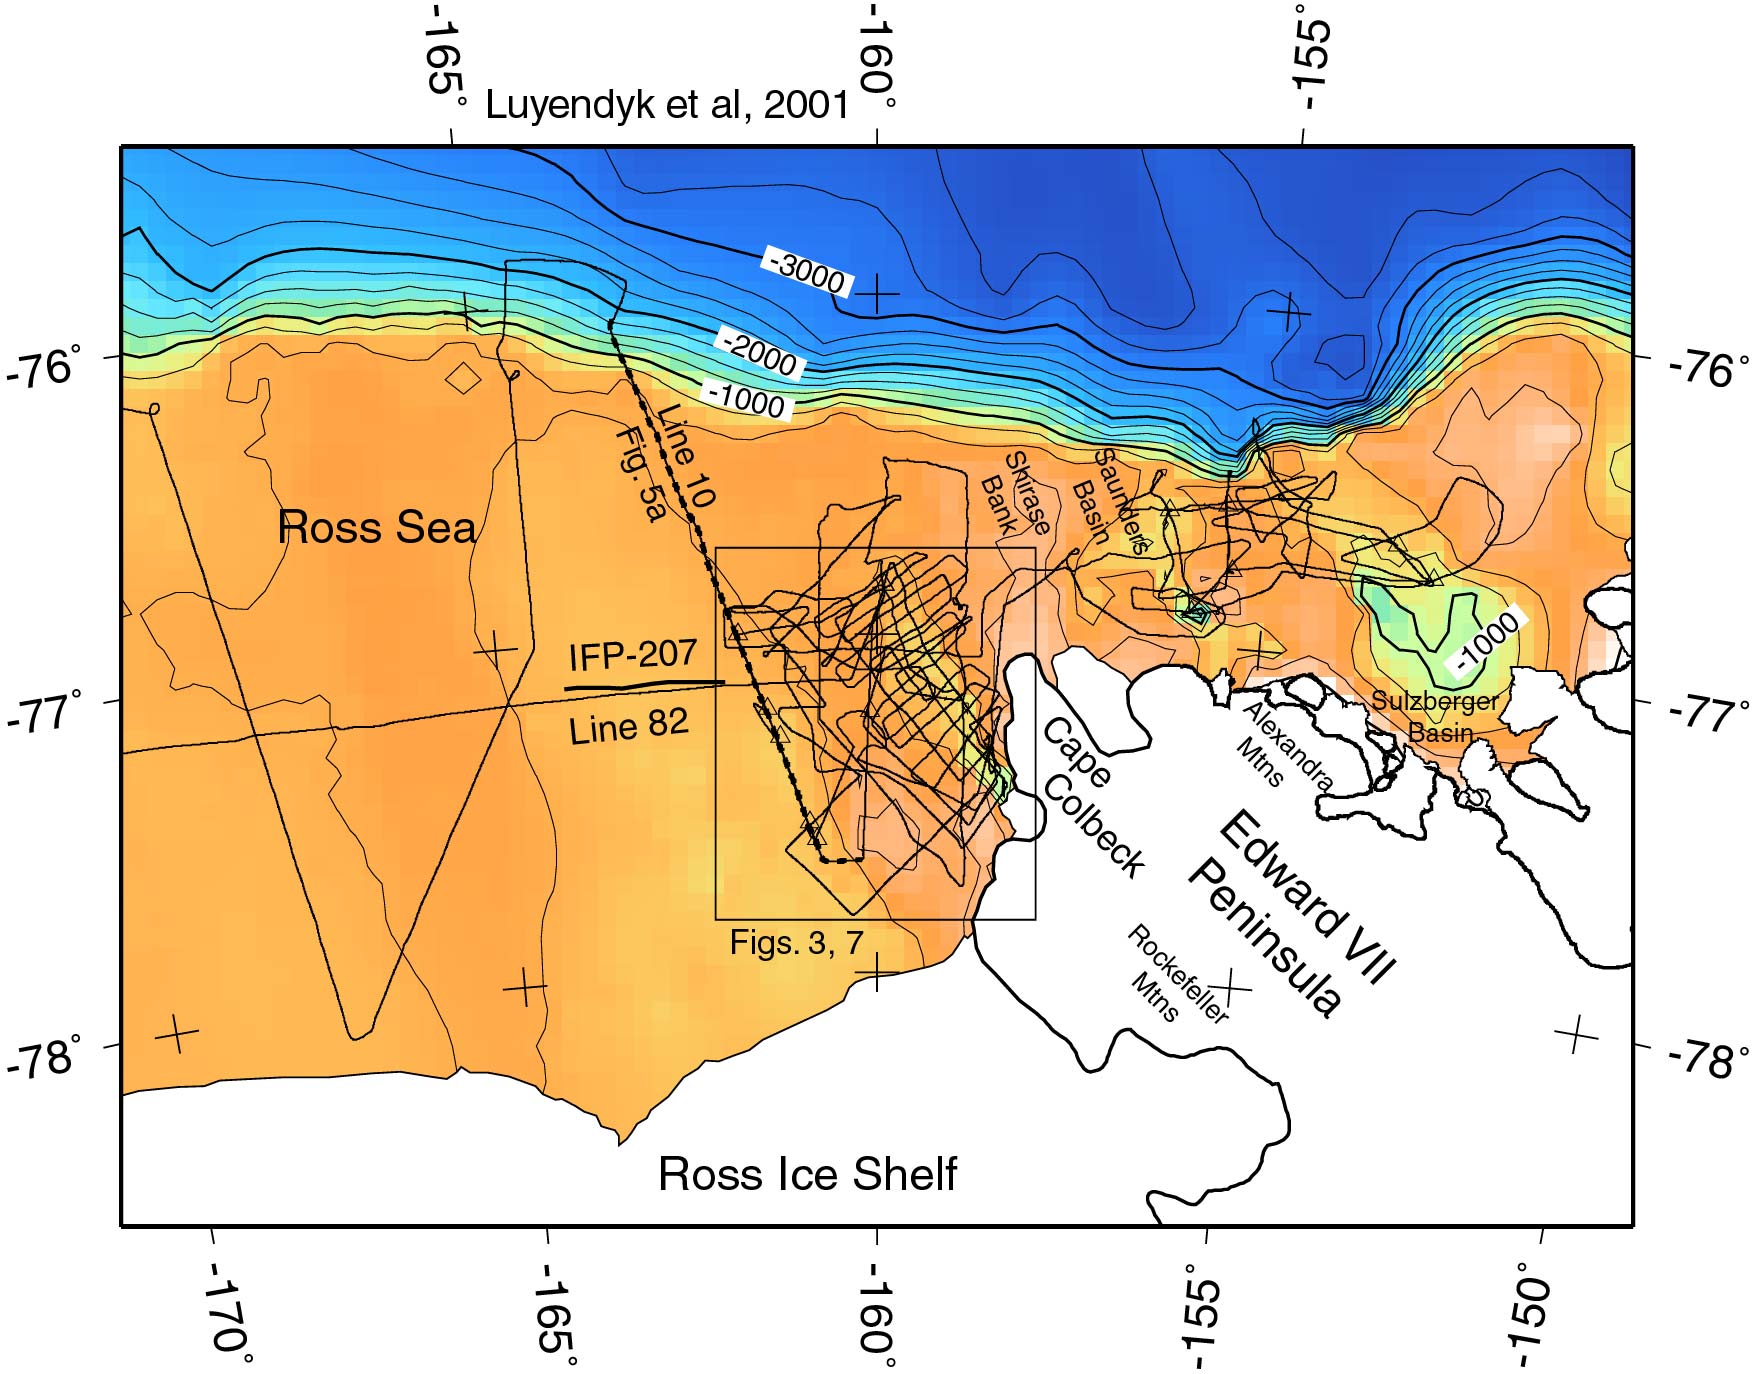
Color version of Figure 2 from Luyendyk et al., 2001. Bathymetry in the eastern
Ross Sea and offshore western Marie Byrd Land. Contour interval 250 m; polar stereographic
projection. Location of detailed bathymetry and gravity maps (Figures 3a and 7) and seismic
lines 10 (Figure 5a), 82, and IFP-207 are shown. Triangles are coring locations. Ice grounding
lines (bold) and shelf edges (fine) are shown.
|
|
|
|
|