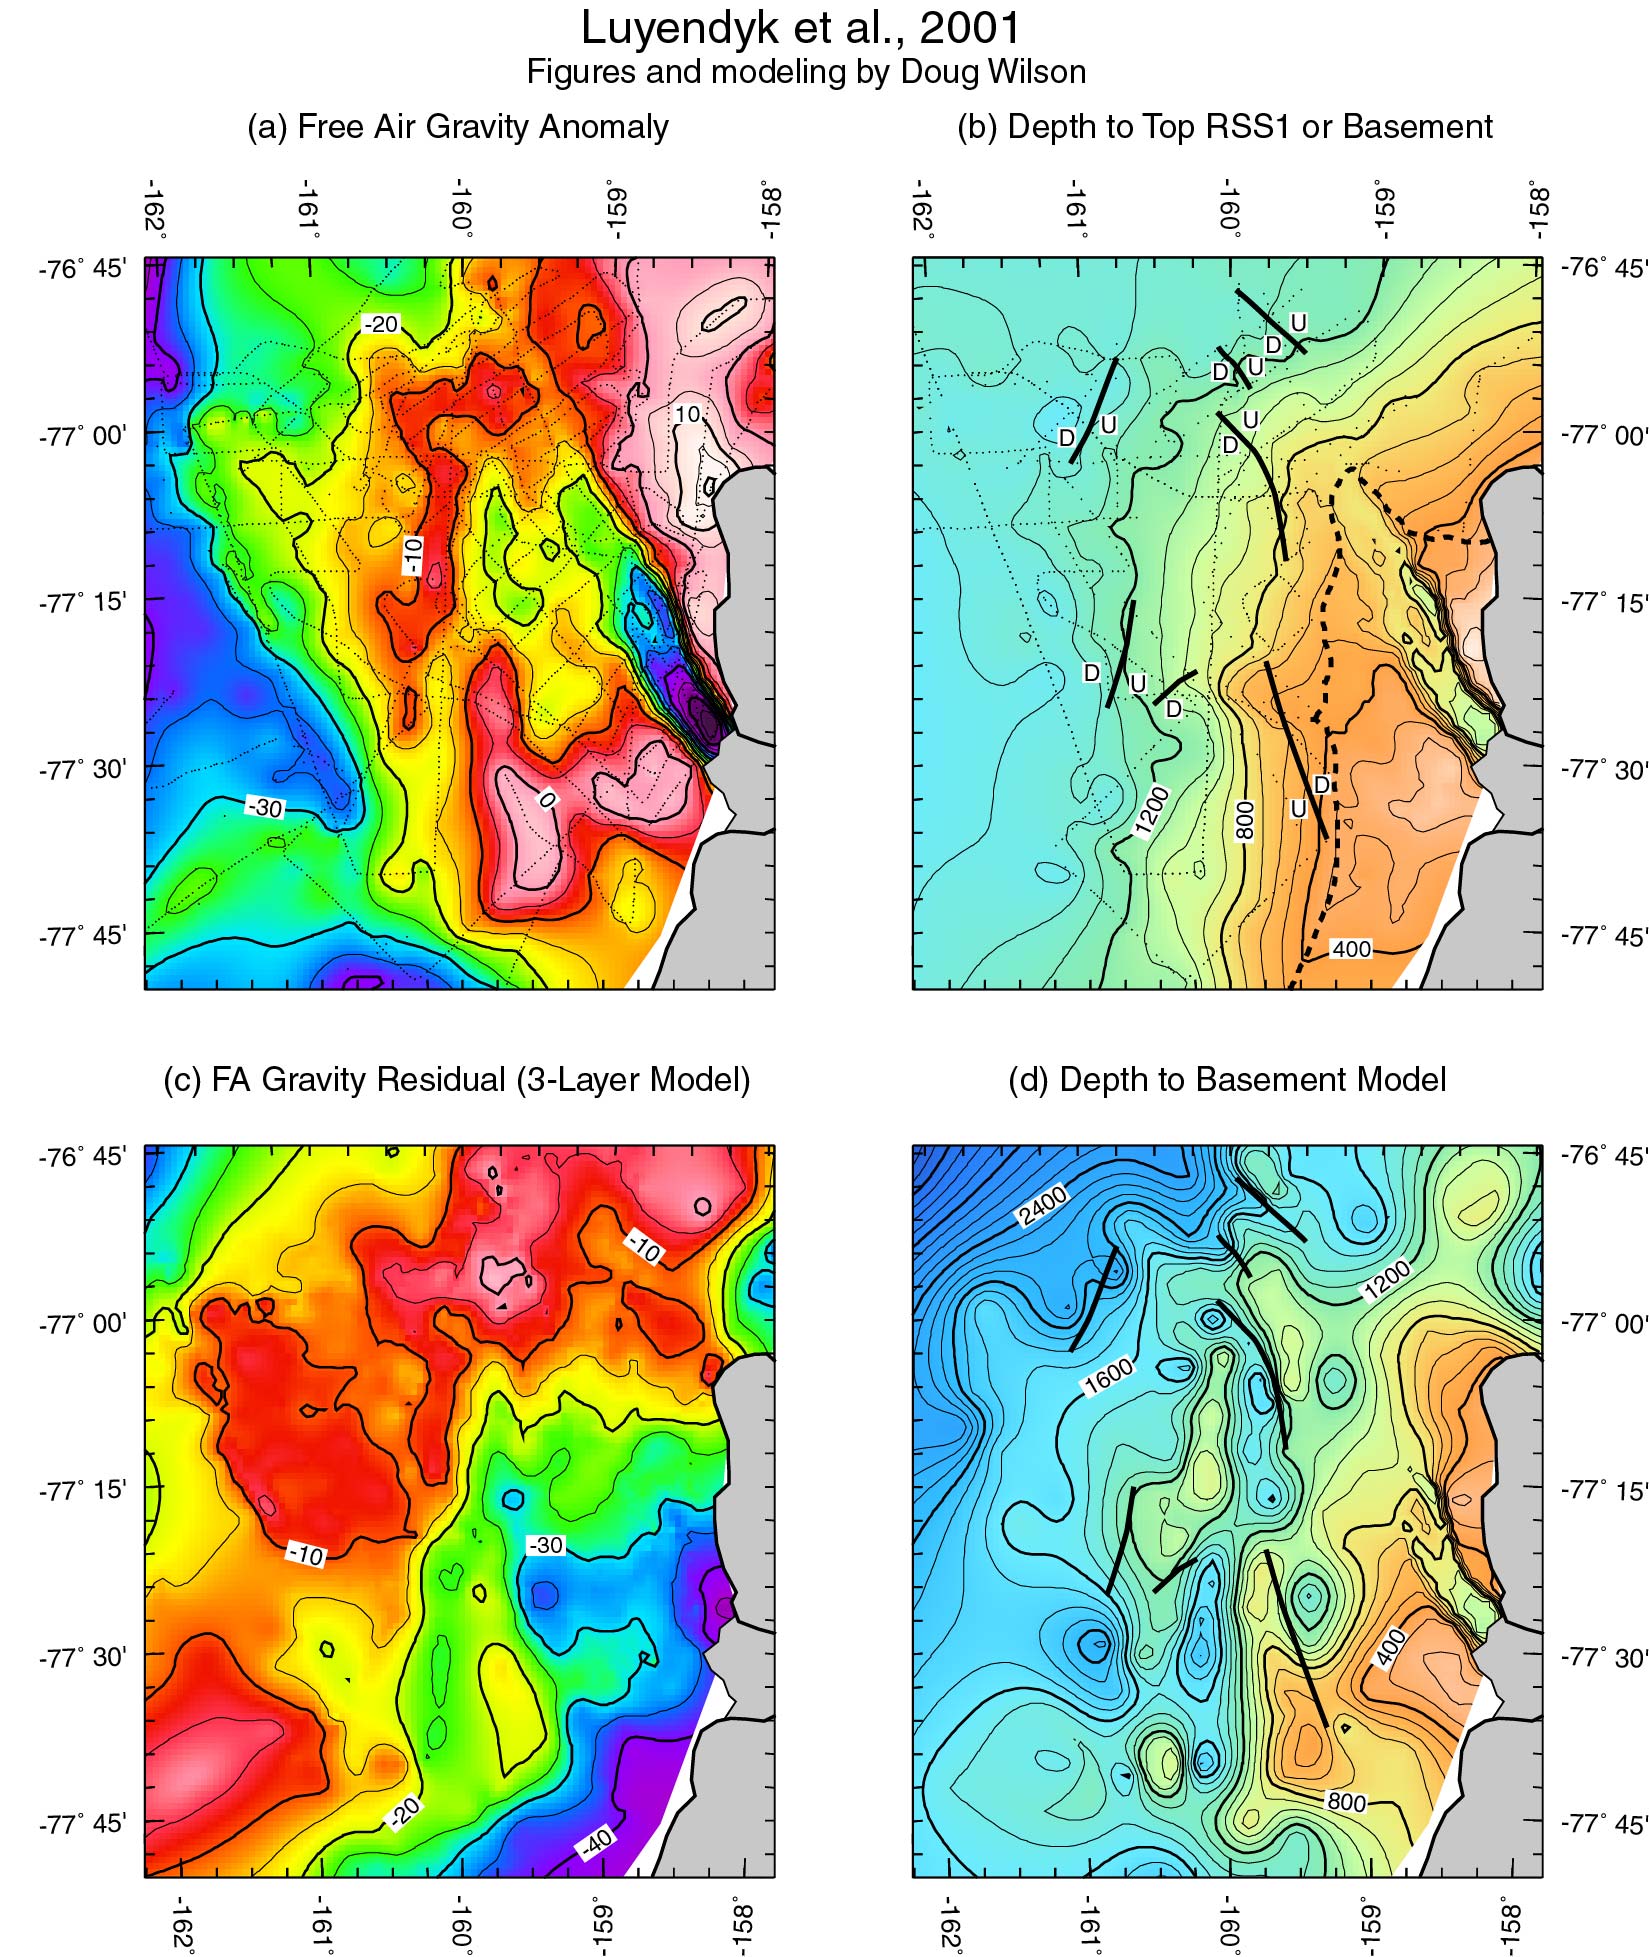
7b: Structure-contour map on probable Oligocene unconformity RSU6 between RSS2 and underlying RSS-1 or basement. This map is based on seismic data (dots) and has been converted to depth using velocity analysis during multichannel processing. Bathymetry is plotted southeast of dashed line where RSS-2 has been eroded and RSS-1 or basement outcrops at the sea floor. Contour interval 100 meters. Locations of faults that cut the RSS-1 sequences are shown.
7c: Residual FAA calculated by subtracting a forward gravity model comprising three layers: water, younger sediments, and undifferentiated older sediments plus basement (Figure 7b) from the observed FAA (Figure 7a). Model densities are 1000 kg/m cubed for water, 2000 kg/m cubed for younger sediments, and 2650 kg/m cubed for older sediments and basement.
7d: Depth-to-basement model computed iteratively to satisfy the shorter wavelength
components of the residual FAA in Figure 7c. Here layer 3 of the 3-layer model
(older sediments and basement) was further divided into basement with density 2850/kg/m cubed
and overlying syn-rifting sediments of RSS-1 with a density of 2200 kg/m cubed.
The modeled basement shows northerly to northwesterly-trending highs and lows with
relief approaching one kilometer.