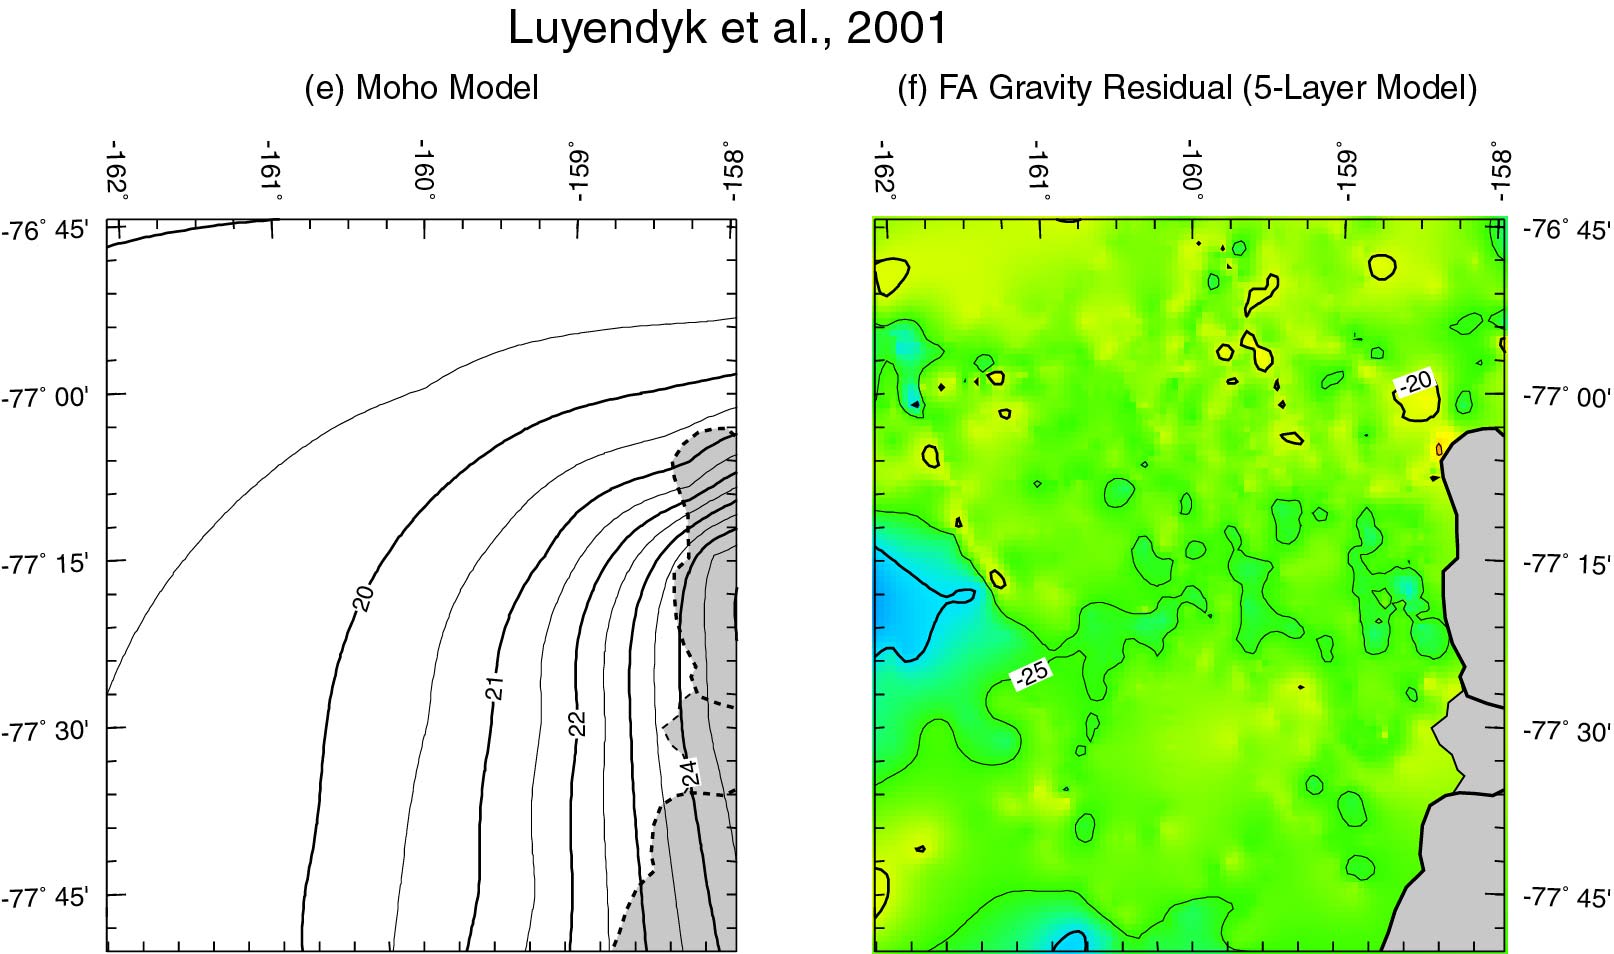
7e: Depth-to Moho model computed iteratively to satisy the longer wavelength components of the residual FAA in Figure 7c. Assuming a density contrast of 400 kg/m cubed across Moho, crust thickens southeastward by several kilometers approaching the shoreline. Contour interval 0.5 km.
7f: Residual FAA calculated by subtracting the complete 5-layer forward gravity
model (water, young sediments, old sediments, basement, mantle) from the observed
FAA in Figure7a. Contour interval 5 mgal.