|
|

|
last update: 20 October 2000
|
Fault displacement and fold contraction estimated by unfolding of Quaternary
strata, onshore and
offshore Ventura basin, California
Investigators:
Christopher C. Sorlien and Marc J. Kamerling
Past student geophysicist and original (2-98) web design:Carmen M. Alex
Past student geophysicist: Kirsten Zellmer
The onshore top Lower Pico Formation map was constructed using published
cross sections and the
Hopps et al. cross sections that Craig Nicholson
made a major effort to have made available.
Funded by the U.S. Geological Survey
National Earthquake Hazards Reduction Program
|
|
|
Research supported by the U. S. Geological Survey (USGS), Department of the Interior,
under USGS award number 1434-HQ97-GR-03085. The views and conclusions contained in this document
are those of the authors and should not be interpreted as necessarily representing the official
policies, either expressed or implied, of the United States government.
Non-technical Summary
The Oak Ridge fault of southern California has been interpreted either as an
active fault that cuts to earthquake-source depths onshore and offshore, or
alternatively as only a shallow fault onshore, and an axial surface of a fold offshore. We
mapped the geometry of deformed layers along this structure, and restored the folded layers
to an initial horizontal state. Results to date indicate a
continuous onshore-offshore fault, but that slip on the deep offshore fault is
mostly absorbed by shallow folds.
Note
The results discussed below date from February, 1998.
Detailed results of the map restoration
and additional figures can be found in our USGS-NEHRP final technical report.To download
our USGS Technical Report click:
USGS.
Then, go to Annual summaries, vol 40, Southern California, and go to Sorlien & Kamerling.
Our NEHRP Final Technical Report for a Renewal was completed in October 2000.
|
|
|
Introduction
|
|
|
The objective of the project is to quantify the amounts, directions, and
rates of movements on prominent faults in the region of the offshore Ventura
basin, California (Santa Barbara Channel), and the adjoining part of the
onshore Ventura basin. The contraction due to folding, which is related to
slip on both blind and surface faults, is also quantified. This region is
traversed by the same structural trends responsible for the M>7 1812
earthquake, M6.3 1925 Santa Barbara earthquake, the M6.7 1971 San Fernando
earthquake and the M6.7 1994 Northridge earthquake. The Oak Ridge fault has
been interpreted either as an active fault that cuts to seismogenic depths
onshore and offshore (Yeats, 1988; Huftile and Yeats, 1995; Kamerling and
Nicholson, 1996), or alternatively as being detached at a few kilometers depth
onshore, and being an axial surface of a fold offshore (Shaw and Suppe, 1994).
|
|
|
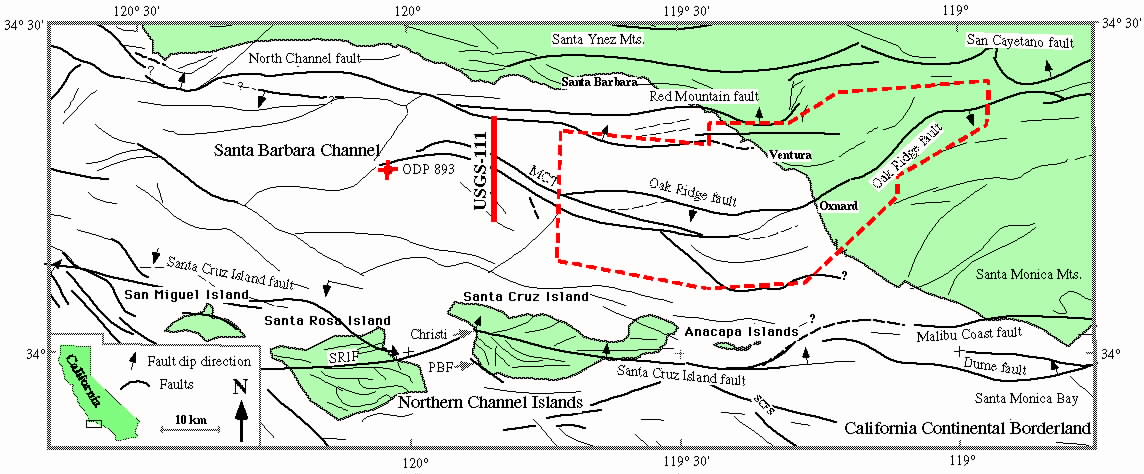
Figure 1: Faults and locations of the western Transverse Ranges.
Abbreviations: MCT=Mid Channel trend; SCFS=San Clemente fault system;
SCrIF=Santa Cruz Island fault; SRIF=Santa Rosa Island fault. Faults are from
Jennings (1994) onshore and south of the islands, and are mapped on the top
Monterey Formation (~6 Ma) beneath the Santa Barbara Channel (Sorlien and
others, 2000).
|
|
|
Method
Structure-contour maps are constructed, then these maps are unfolded (using
the UNFOLD software), and the flattened surfaces are fit back together using
an
interactive graphics program (Gratier and others, 1991, 1999; Gratier and Guillier,1993).
Comparing the restored surfaces to the present-day deformed surfaces
gives the finite displacement during Quaternary time, and restoring both
surfaces allows us to determine how displacement has changed with time.
Contraction due to folding for each fault or fold block is also calculated bythe UNFOLD program.
Three-dimensional views and block diagrams are being
constructed in order to communicate complex three-dimensional structure.
Results
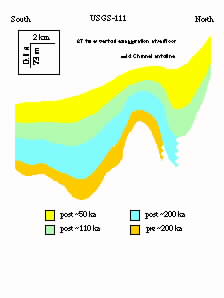
We correlated a reflection dated at 110 Ka (+/-
10%)(depending on the velocity used for depth-travel time conversion; see also
Elliot and Kamerling, 1995), a reflection extrapolated to be ~200 Ka
(+20%-10%), and one interpolated to be 250 Ka (+60%/-20%) throughout dense
grids of single-channel and 12 fold multichannel seismic reflection
data in central Santa Barbara Channel. The age of the ~250 Ka reflection was
estimated by interpolation between the dated ~110 Ka and a dated 1 Ma
reflection in the deeper basins of central Santa Barbara Channel, where the
depths of the 110 Ka, 200 Ka, and 1 Ma horizons indicate relatively constant
sedimentation rates. The horizons were dated using results of shallow ocean
drilling program site 893 which was drilled to 200 m depth beneath western
Santa Barbara Channel. Careful dating shows that the oldest sampled strata are
160 Ka (Kennett, 1995).
Results also include the completion of the map of the ~1 Ma horizon (975
+/-75 Ka; Huftile and Yeats, 1995). The onshore part of the map was
constructed from Yeats (1981 and 1989), and slightly modified by interpolation
of additional contours. Depths from the offshore map and cross sections of
Yeats (1981, 1983) were converted to travel time using velocity surveys in
wells, and then correlated through a grid of 1970s-vintage multichannel
industry seismic reflection data loaned to the project by Occidental Oil and
Gas. Velocity surveys in numerous wells were used to convert the travel timesback
to depth. These depths were combined with the depth contours of Yeats
(1981), and a new map created. This map shows folding and reverse faulting
along the Mid Channel and Oak Ridge trends, folding of the Ventura Avenue
anticline, the steep fold limb above the blind San Cayetano fault, and the
large vertical motions across the onshore Oak Ridge fault. This ~1 Ma map has
been digitized and restored.
|
|
|
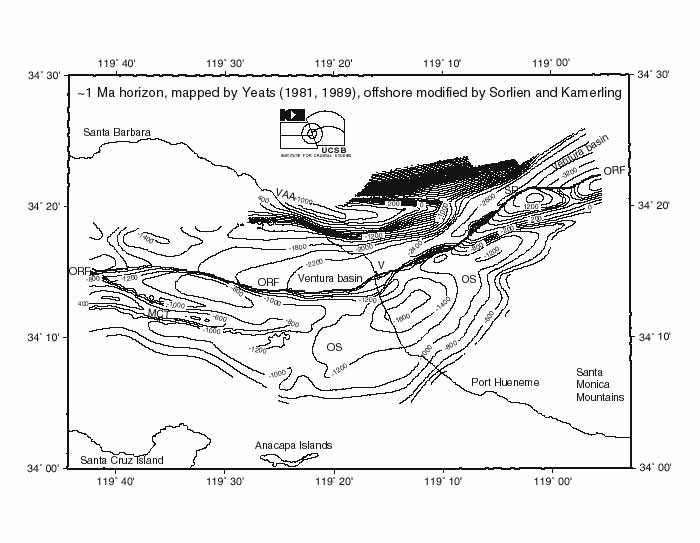
Figure 2: Structure-contour map of the ~1 Ma horizon. Contour interval
is 200 m; MCT, Mid-Channel trend; OS, Oxnard Shelf; SP, Santa
Paula; V, Ventura; VAA, Ventura Avenue anticline. A problem in the
transformation from X-Y to Longitude-Latitude has been corrected in this
figure, and the corrected grid has been replaced in our 1998 NEHRP
Technical Report.
|
|
|
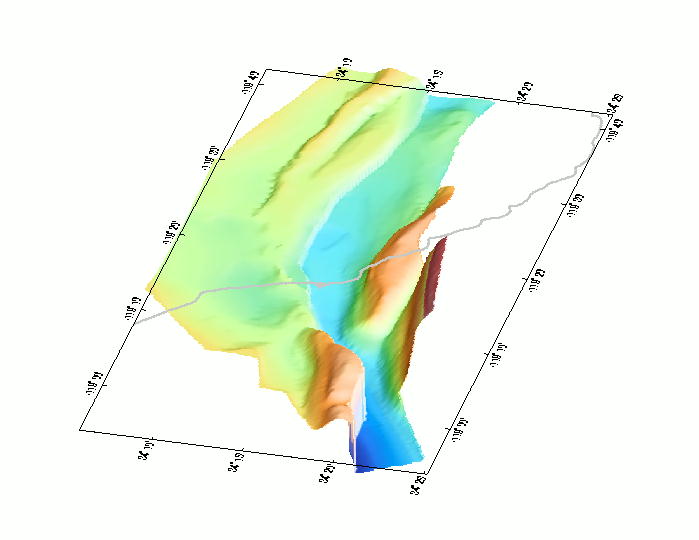
Figure 3: Oblique shaded relief view towards west-southwest from 30 degree
elevation of ~1Ma horizon in figure 2. Due to the oblique view, relatively high
areas such as Ventura Avenue anticline appear WSW of their actual positions
relative to the coastline and to the latitude-longitude references. Use the
vertical view contour map for the actual position of the structures.
|
|
|
We also have mapped a ~1.8 Ma (top Venturian faunal stage) horizon in travel
time and are working at converting it to depth. This ~1.8 Ma horizon (top
Lower Pico) has been mapped using paleontology, e-log correlations and a grid
of high-quality multi-channel seismic reflection data in the eastern Santa
Barbara Channel. The onshore map is constructed using numerous cross sections
in the Hopps data set (Hopps and others, 1995; Nicholson and others, 1997),
published cross sections from Yeats and others (Yeats, 1981, 1983, 1988;
Huftile and Yeats, 1995; etc.), and geologic maps (e.g. Dibblee, 1992).
Significance and Discussion
Our mapping, restorations, and visualization provide information that can be
used to compare models for folding above blind faults. These models have been
developed in work with L. Seeber of Lamont (Seeber and Sorlien, submitted).
For example, fault-bend fold and fault propagation fold models predict
parallel layers of the syn-thrust strata (Suppe and others, 1992; Shaw and
others, 1994). Our structure-contour maps, when complete, will be compared to
see if they are parallel, or non-parallel as predicted by detachment fold and
listric thrust models (Epard and Groshong, 1995, Erslev, 1986).
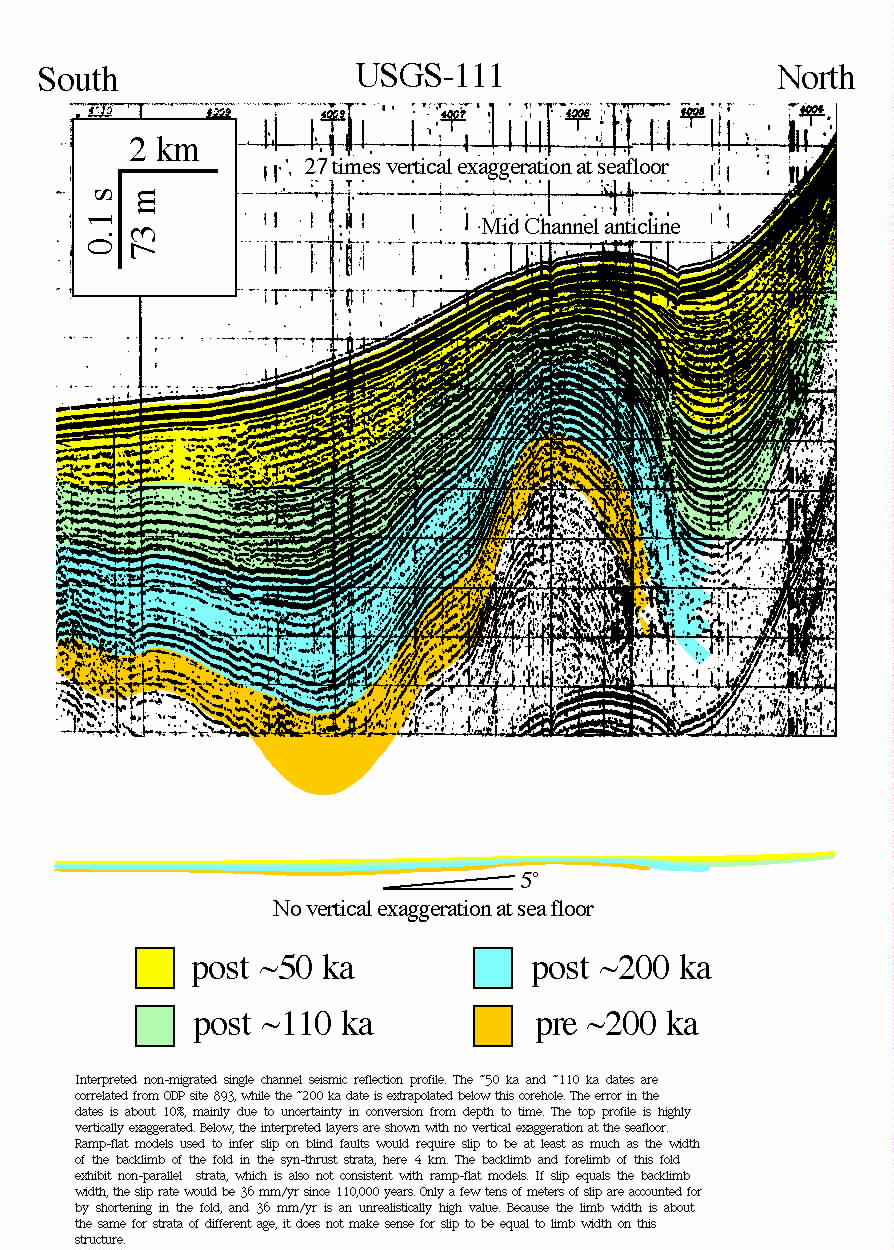
The ~6 km wavelength folding of the Mid Channel (Blue Bottle) trend beneath
Santa Barbara Channel provides a clear example to compare models. The western
part of this structure is a N-verging fold. The backlimb is the same width, 4
km, for strata of different age, but the dip increases with increasing age for
the post-160,000 year reflections dated at ODP site 893. It does not make any
sense here for the slip to be greater than or equal to the backlimb width, as
is required for syn-thrust strata by the fault-bend fold and fault-propagation
fold models (Suppe, 1983; Suppe and Medwedeff, 1990). If this were true, slip
since deposition of a 110,000 (+/- 10%) horizon would be 36 mm/yr, and would
be 80 mm/yr for a 50,000 year horizon. In contrast, a listric thrust model
predicts that slip is proportional to limb dip, and that the observed fold can
be created with 1 or 2 orders of magnitude slower slip (Seeber and Sorlien,
2000).
The Mid Channel trend fold has increased in amplitude at 2 mm/yr since 200 Ka
over part of its length, the same rate as the vertical motions due to fault
slip and folding since 1 Ma. Huftile and Yeats (1995) proposed that since ~0.5
Ma, slip on the deep offshore Oak Ridge fault has been transferred to folds
along the northern margin of Ventura basin at rates of 5 mm/yr. Our results
indicate no change in the last 1 m.y. of rates of vertical motions due to slip
on the offshore Oak Ridge fault and due to related folding, although there may
be a change in the partitioning of this motion between faulting and folding.
Shortening across the offshore Oak Ridge fault and its hanging-wall folds (Mid
Channel trend) is only a few hundred meters in the last 1 m.y. Blind slip
transferred to folds along the north margin of offshore Ventura basin will be
evaluated using map restoration and by modeling the shape of the offshore
folds against different possible fault geometries.
Shortening and vertical motion across the onshore E-W Oak Ridge fault are
related to left-lateral motion on the ENE-WSW coastal section, which is again
transformed into shortening and vertical motions on the ESE-WNW segment south
of Santa Barbara. Onshore, near Santa Paula, the map restoration documents
space problems that require the post-1 Ma left-lateral component across the
Oak Ridge fault to be less than half the 3.5 km proposed by Yeats and Taylor
(1989), or else that left-lateral shear is transferred across the footwall
(north) block. NE-striking cross faults are suggested by the sharp bends in
both the fault near Santa Paula and offshore, and by a sharp bend in a
regional N-dipping fold limb between Oxnard shelf and Santa Cruz Island.
|
|
|
Click here for References.
For problems with this page or questions about content, contact
Christopher Sorlien
Internal.
|