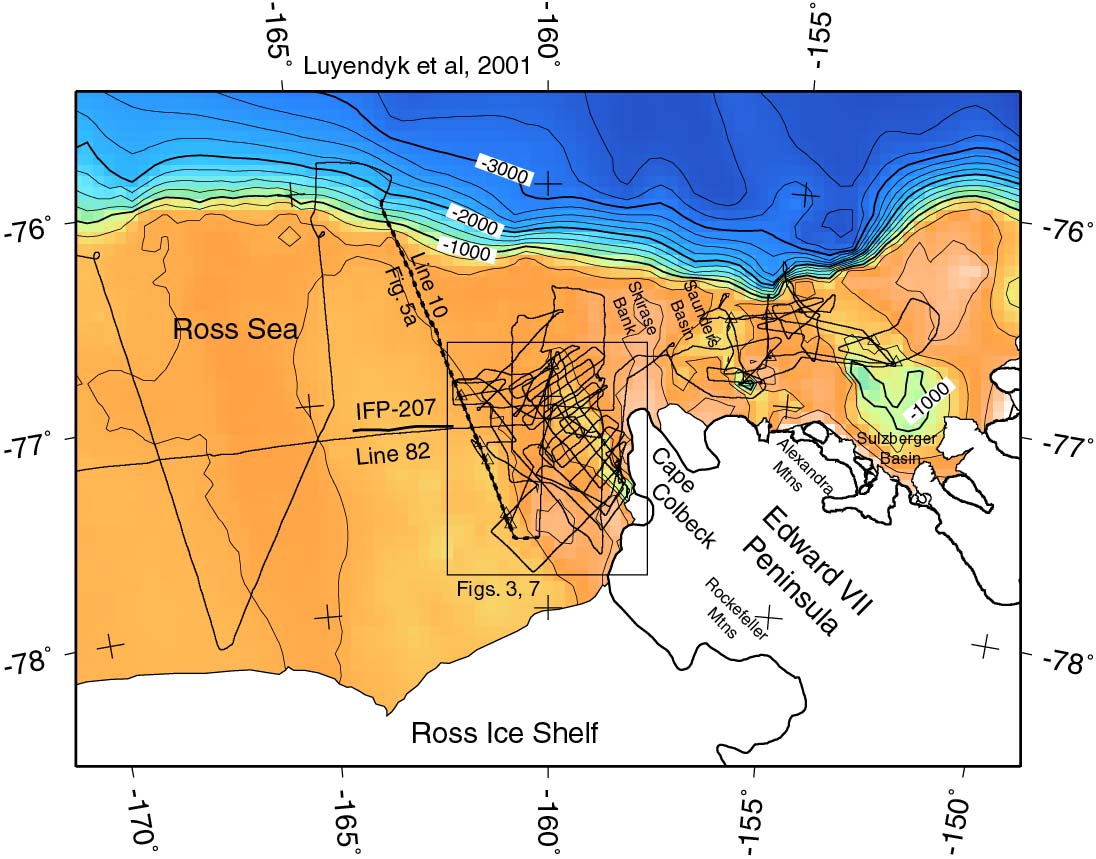
Bathymetry of eastern Ross Sea and offshore Marie Byrd Land. This is the color version
of Figure 2.
Click on image for larger view and full caption (0.36 Mbytes).
Or, click here to download 0.13 Mbyte
pdf version
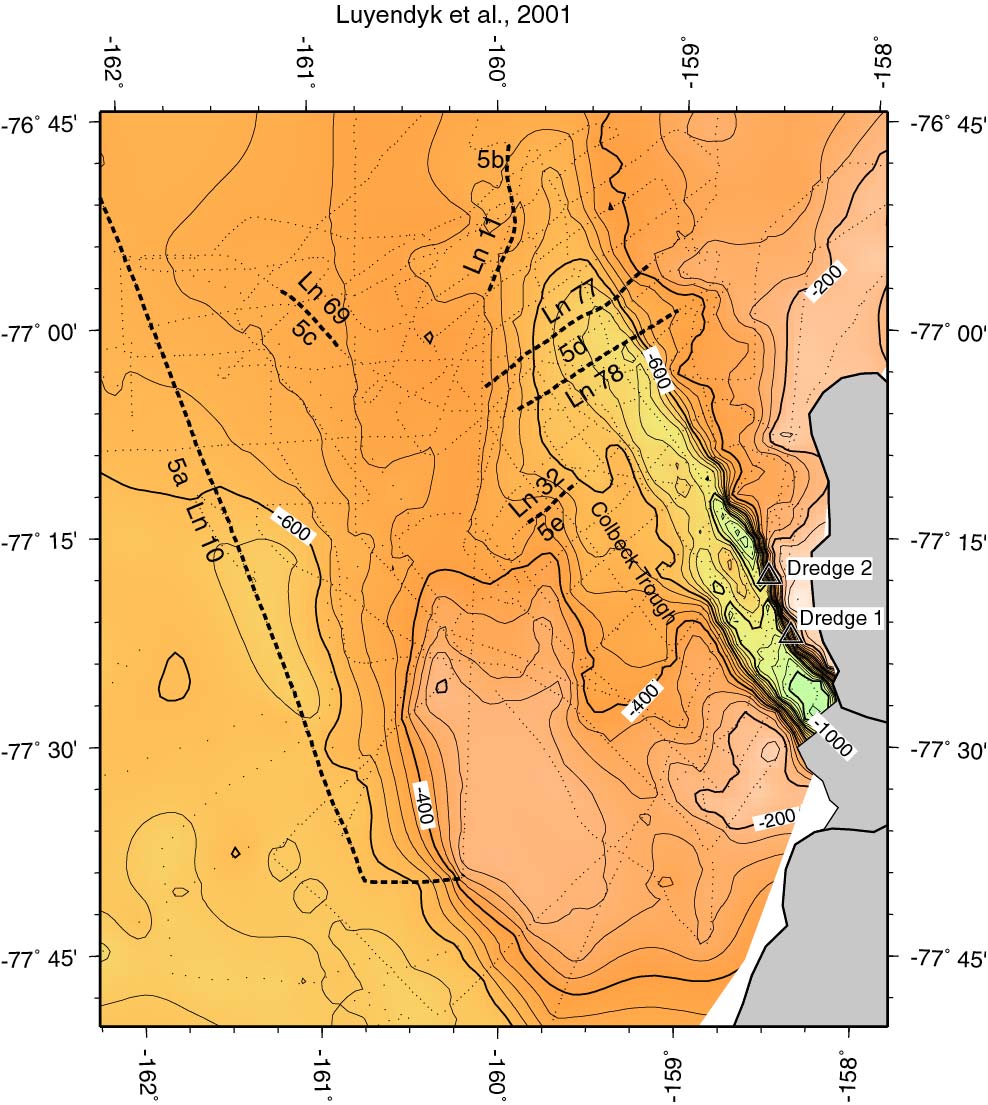
Bathymetry of Colbeck Trough part of eastern Ross Sea. This is the color version
of Figure 3a.
Click on image for larger view and full caption (0.36 Mbytes).
Or, click here to download 0.15 Mbyte
pdf version
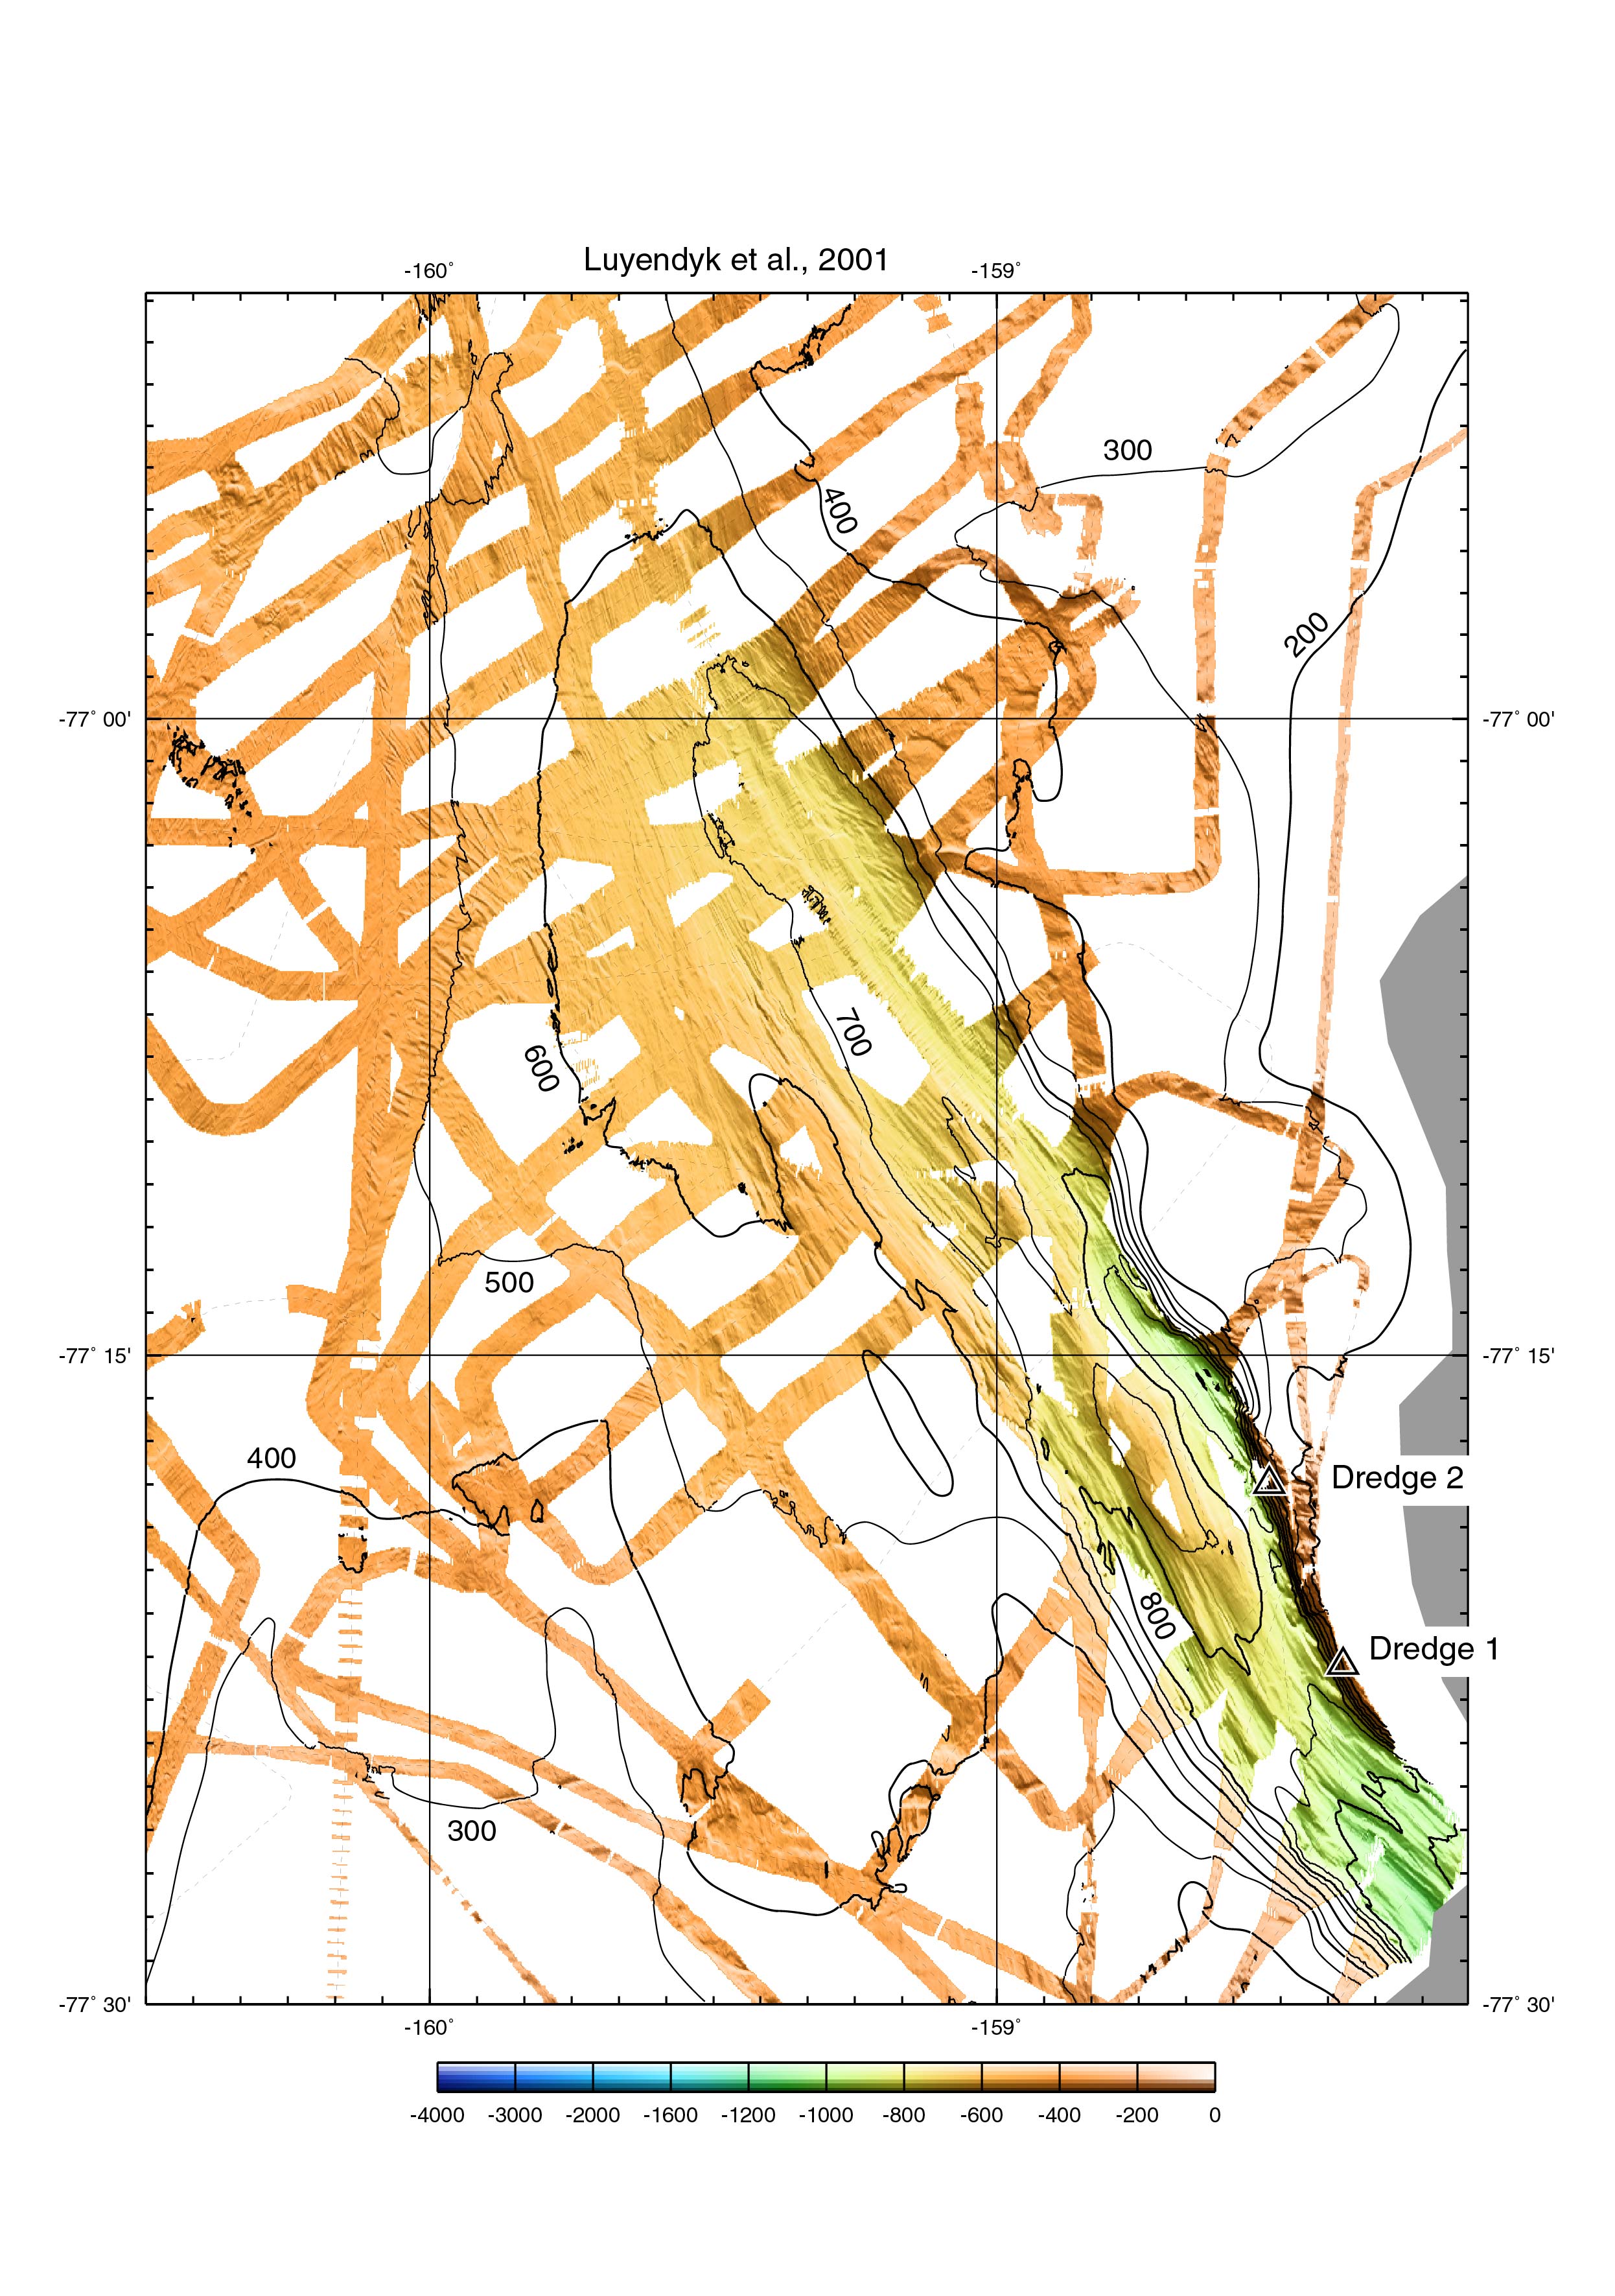
Shaded-relief multibeam bathymetry of Colbeck Trough area. This is the color
version of Figure 3b.
Click on image for larger view and full caption (0.92 Mbytes).
Or, click here to download 2.37 Mbyte
pdf version
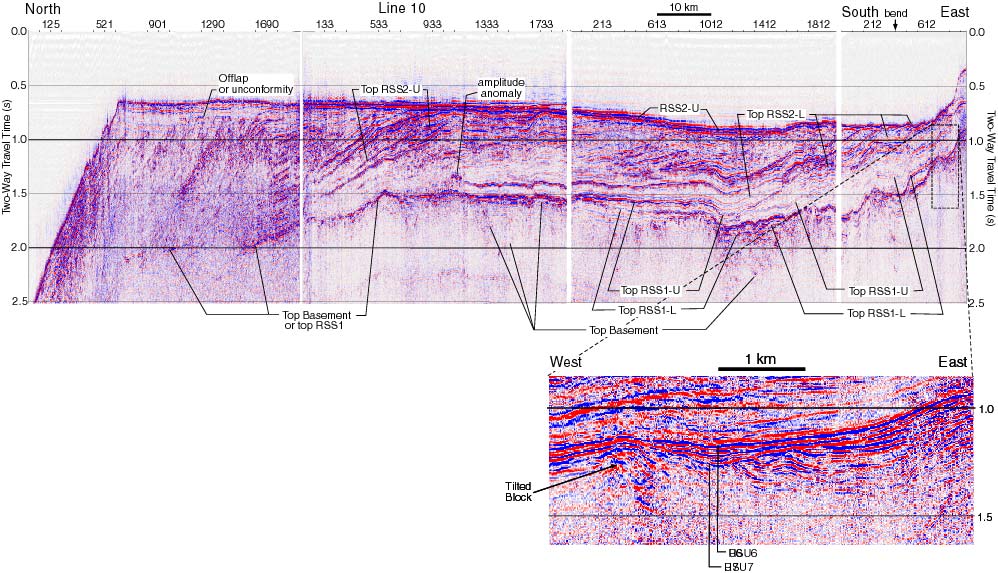
Color version of Figure 5a. Seismic Line 10 at high vertical exaggeration (about
25 times at the seafloor), located in Figure 2. This color amplitude display is
shown in B&W, interpreted, in the published article. Dotted area is shown with only
about 3.4 times vertical exaggeration at seafloor, at the bottom. The regional pattern
is of mid and late Cenozoic strata downlapping to the north against a regional
unconformity.
Click on image for larger view (0.59 Mbytes).
Or, click here to download 1.4 Mbyte
pdf version
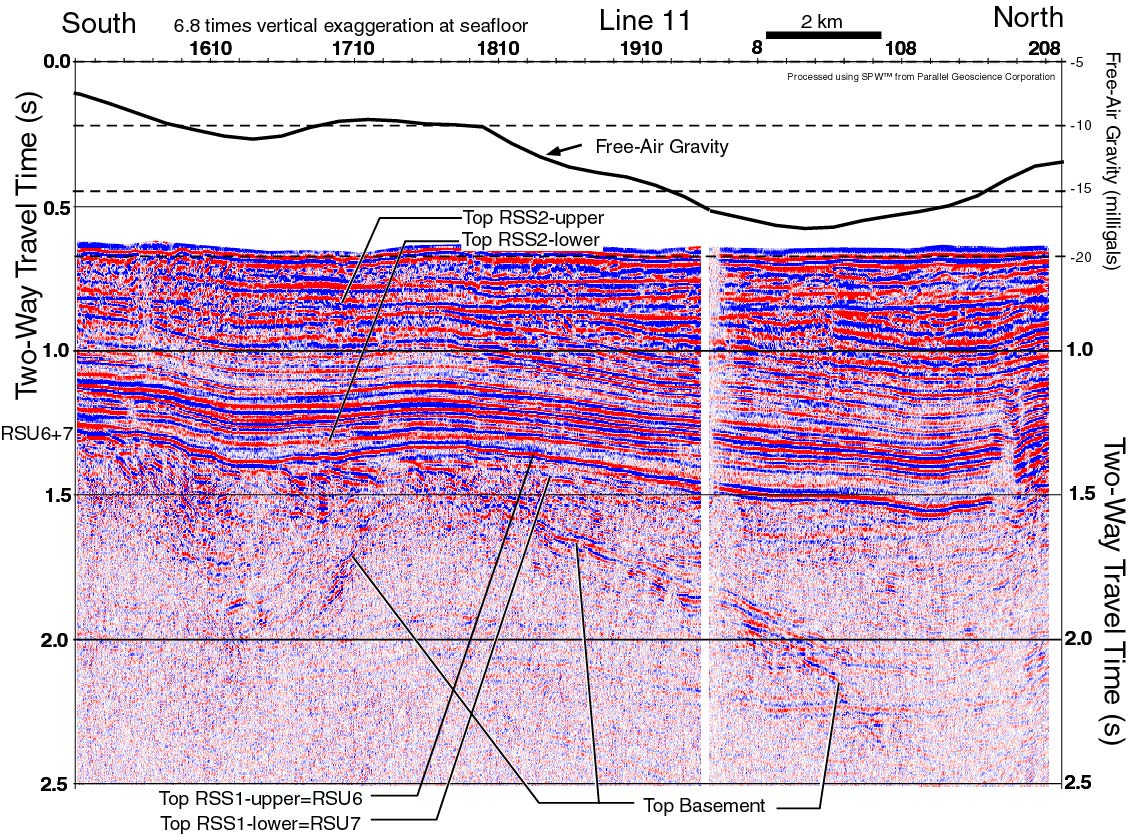
Color uninterpreted version Figure 5b: located in Fig. 3a.
The free-air gravity profile shows that the imaged basins are filled with
low density material.
Click on image for larger view (0.87 Mbytes).
Or, click here to download 0.54 Mbyte
pdf version
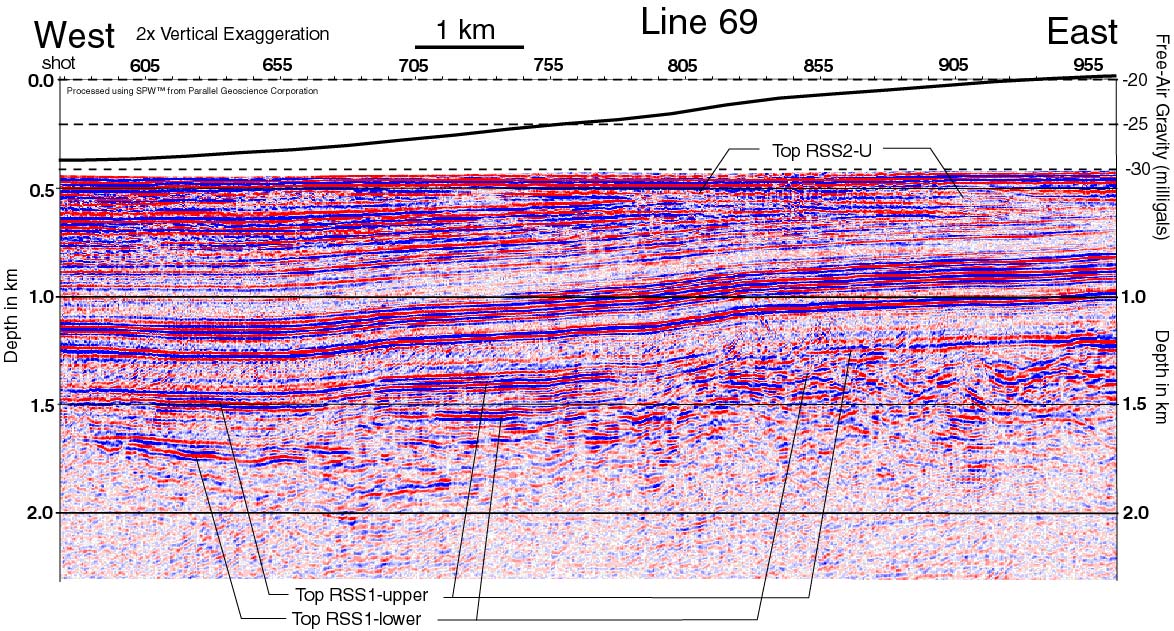
Color Figure 4: Migrated color version of Figure 5c. This figure is shown in depth with
two times vertical exaggeration. Interpreted version is in published article.
Note undeformed upper section and faulted reflections below unconformities.
Click on image for larger view (0.63 Mbytes).
Or, click here to download 0.42 Mbyte
pdf version
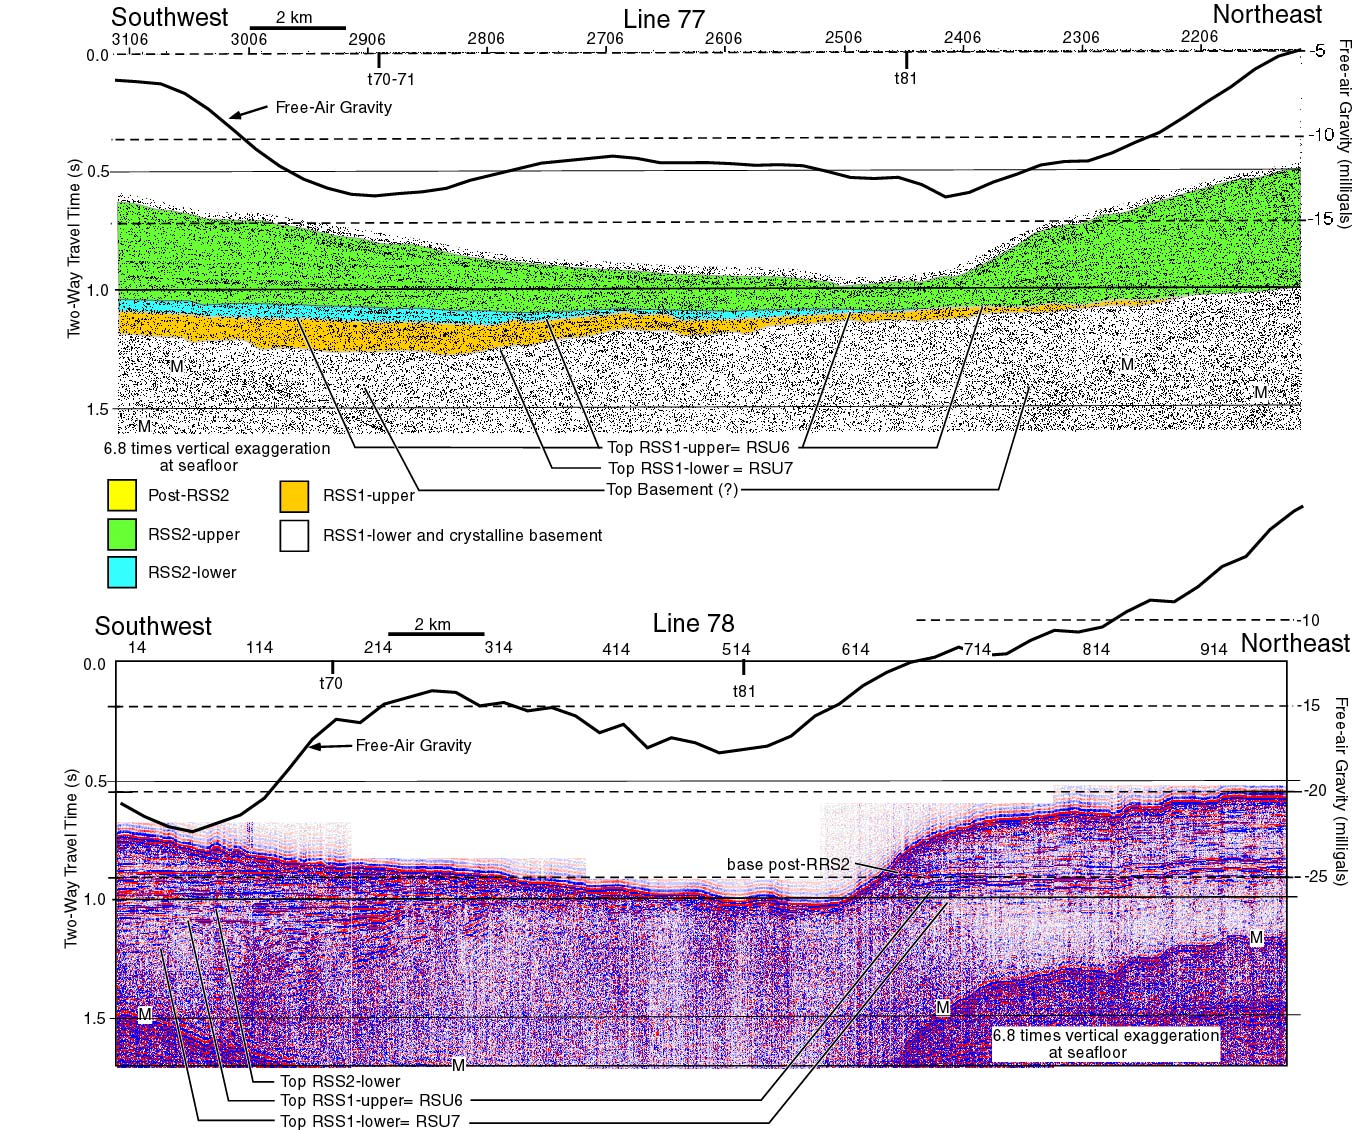
Figure 5d with color interpretation (Line77) and color amplitude (Line 78).
The color amplitude display of Line 77 was not very good. Free-air gravity highs
over the bathymetric low of Colbeck Trough show that this northern part of
the trough does not follow a sub-unconformity sedimentary basin. Indeed, on Line
77 the outer Colbeck trough erodes undeformed late Oligocene and younger strata and
cannot be controlled here by deeper structure.
Click on image for larger view (1.61 Mbytes).
Or, click here to download 3.19 Mbyte
pdf version
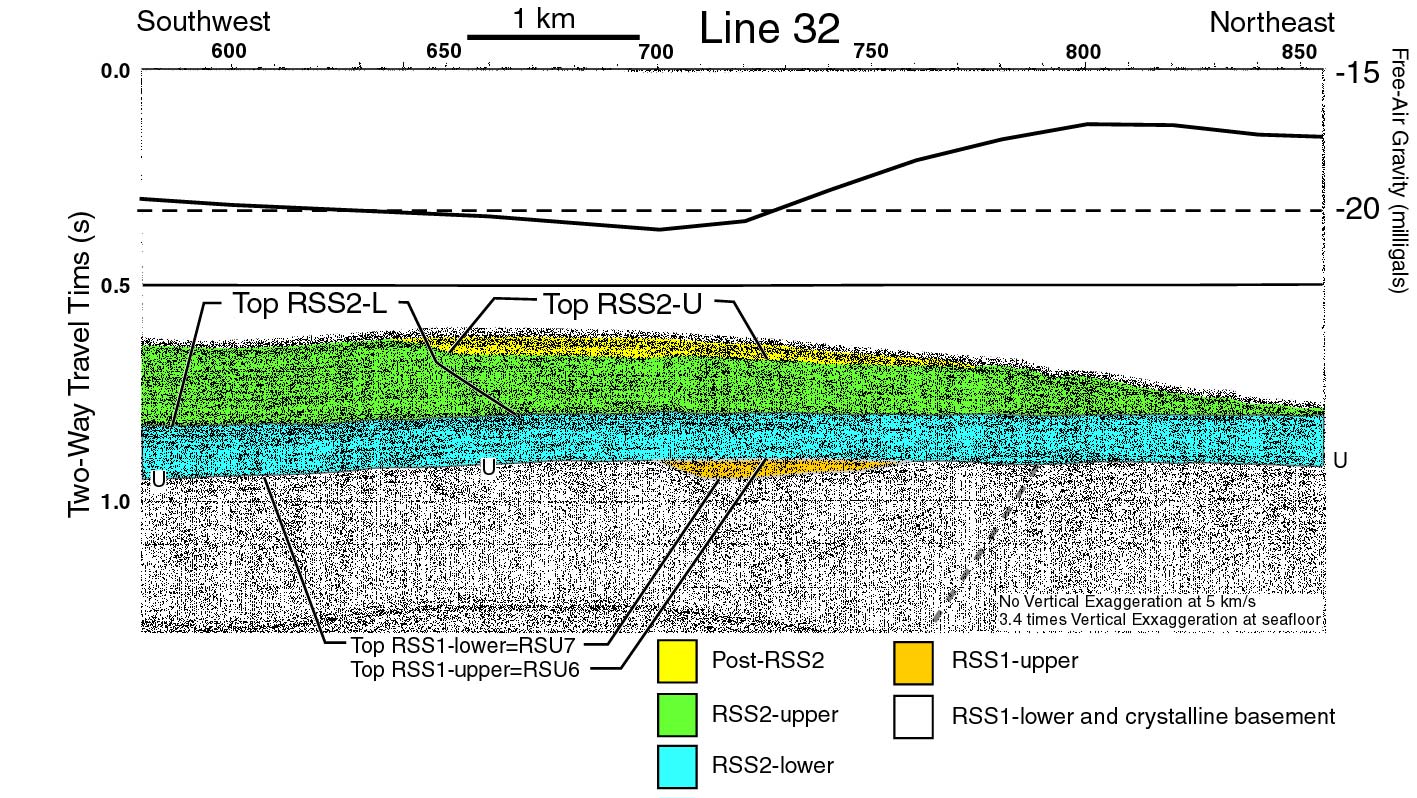
Figure 5e with color interpretation. Vertical exaggeration is 3.4 at the seafloor
on the .pdf version on this non-migrated low fold (3 and 4) profile. The free
air gravity was modeled to show a 500+ m deep basin associated with the synform
near S.P. 700.
Click on image for larger view (1.09 Mbytes).
Or, click here to download 1.49 Mbyte
pdf version
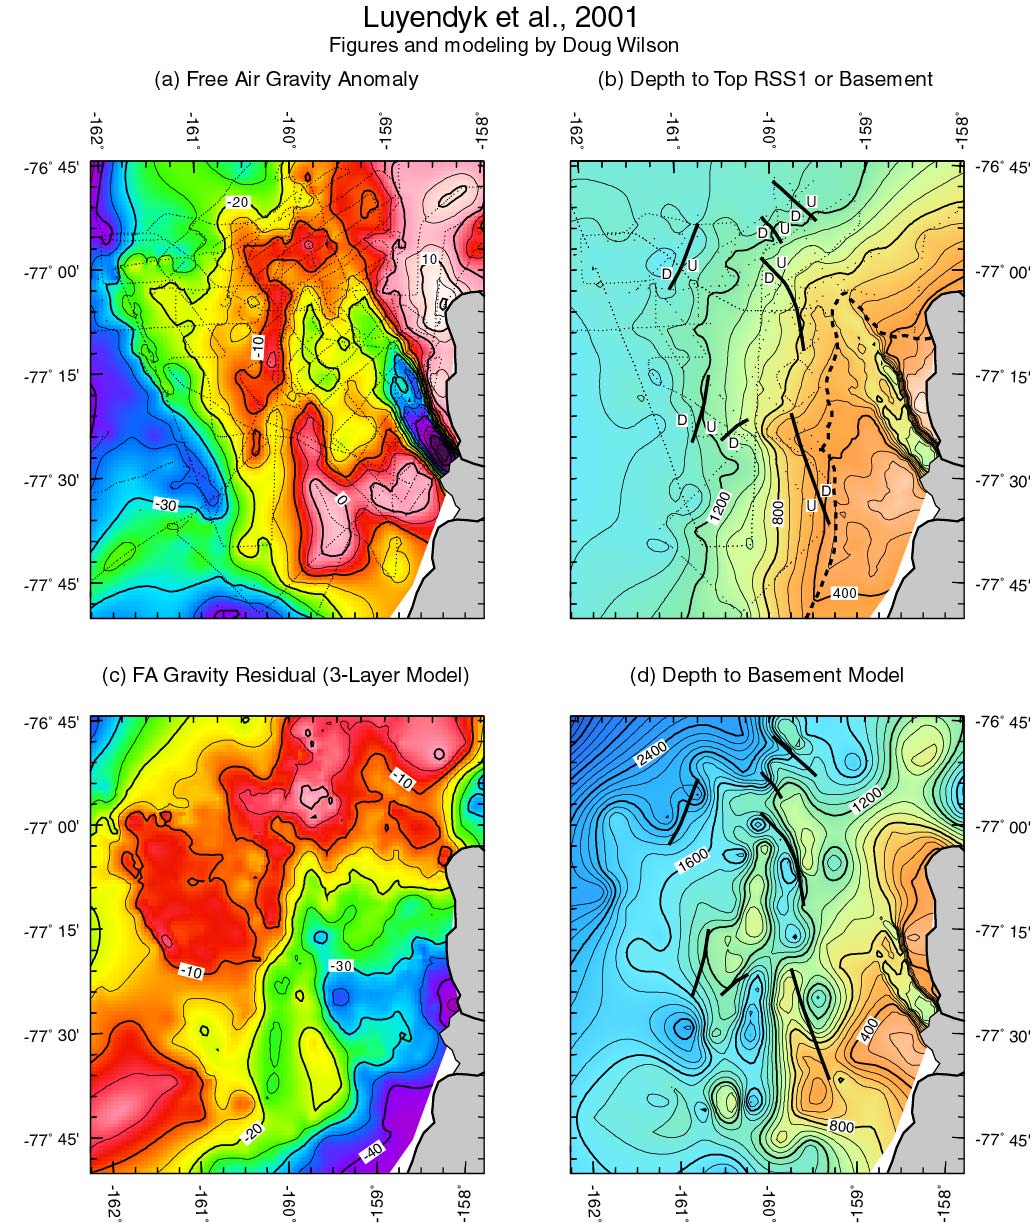
Free-Air Gravity (a), Structure-contour map on Oligocene unconformity (b), residual
gravity anomaly (c), and modeled depth-to-basement (d). These are the color versions
of Figures 7a through 7b.
Click on image for larger view and full captions (0.57 Mbytes).
Or, click here to download 0.34 Mbyte
pdf version
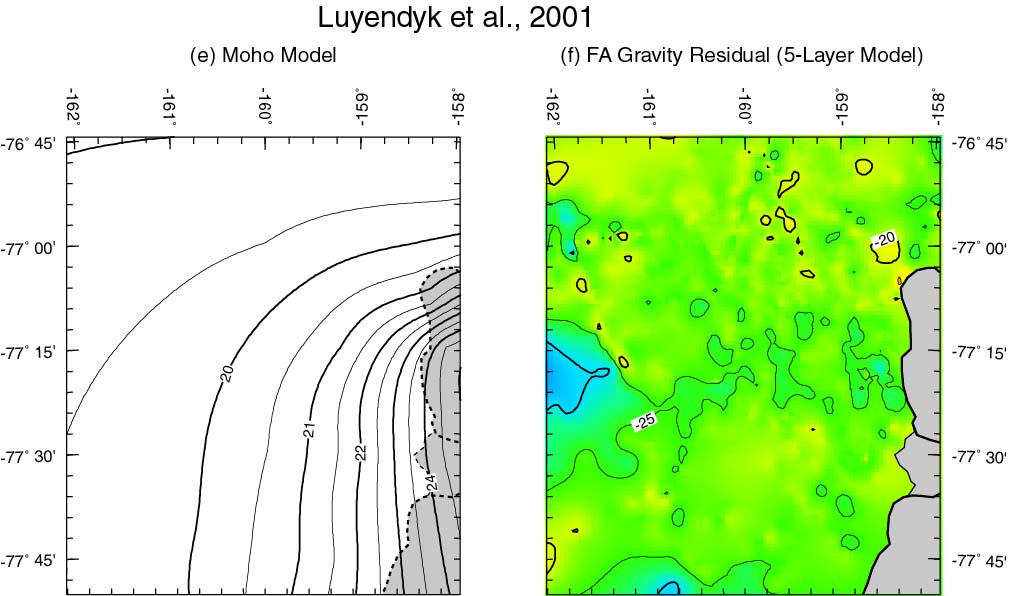
Depth-to-Moho model, (Figure 7e), and residual gravity anomaly after subtracting 5
layer model (Figure 7f).
Click on image for larger view and full captions (0.15 Mbytes).
Or, click here to download 0.06 Mbyte
pdf version
Text of Luyendyk et al. abstract
last update: 01 December 2001